This function generates a
ggplot object.
Usage
histogramRndSigScores(
  rndata,
  data = NULL,
  obs,
  score,
  hist.colour = "black",
  hist.fill = "white",
  bins = 30,
  vline.colour = "darkred",
  vline.linetype = "dashed",
  vline.linewidth = 1,
  labs.title = "Diagnostic Plot",
  labs.x = "Summary Score",
  labs.y = "Count",
  ...
)
Arguments
- rndata
data frame, output of
computeSigScorescontaining random scores.- data
(optional) data frame, output of
computeSigScores.- obs
character string, indicating the sample to plot from
rndataanddata.- score
character string, indicating the score to plot from
rndataanddata.- hist.colour, hist.fill
character strings, aesthetics parameters indicating the colors used to draw the contours and the inside areas of the histogram bars. See also
geom_histogram.- bins
integer, number of bins.
- vline.colour, vline.linetype, vline.linewidth
character strings, indicating the color, type, and width of the vertical line. See also
geom_vline- labs.title
The text for the plot title.
- labs.x
The title of the x axis.
- labs.y
The title of the y axis.
- ...
further arguments to
geom_histogram.
Examples
#Set seed for reproducibility
set.seed(seed = 5381L)
#Define signature size
nsig = 8
#Define row/col size
nr = nsig + 50
nc = 10
#Create input matrix
x = matrix(
data = c(
stats::runif(n = nsig*nc, min = 500, max = 1000),
stats::runif(n = (nr-nsig)*nc, min = 0, max = 700)
),
nrow = nr,
ncol = nc,
dimnames = list(
paste0("g",seq(nr)),
paste0("S",seq(nc))
),
byrow = TRUE
)
#Define signature
sig = rownames(x)[1:nsig]
#Compute Summary Scores
scores = computeSigScores(
x = x,
i = sig
)
#Compute Random Summary Scores
rndscores = computeSigScores(
x = x,
i = sig,
sampling = "bootstrap",
n.repeat = 100
)
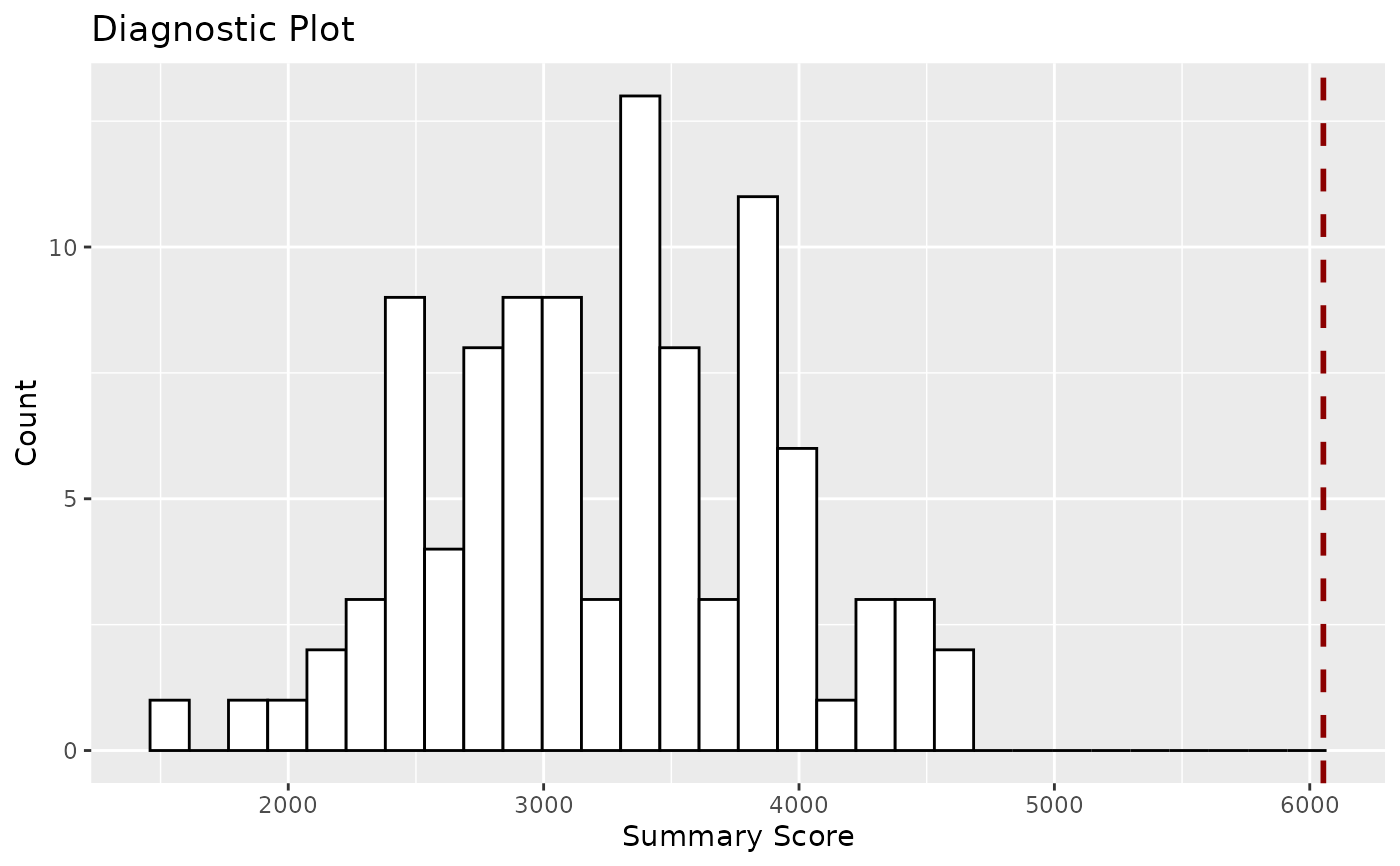
#Plot null distribution
histogramRndSigScores(
rndata = rndscores,
data = scores,
obs = "S1",
score = "sum"
)