Plot a resampling object.
See the Details section below for further information.
Arguments
- x
an object of class
resampling- ...
additional plot arguments
- cell.width, cell.height
width and height of the cells in the heatmap
- col
length-3 vector containing the colors for the heatmap
- border
Whether draw border. The value can be logical or a string of color.
- rect_gp
Graphic parameters for drawing rectangles (for heatmap body). The value should be specified by
gparandfillparameter is ignored.- heatmap.legend.title
character string, title of the heatmap legend
- strata
(optional) vector of stratification variables
- strata.col
(optional) vector of colors for the stratification variables
Value
A Heatmap-class object.
Details
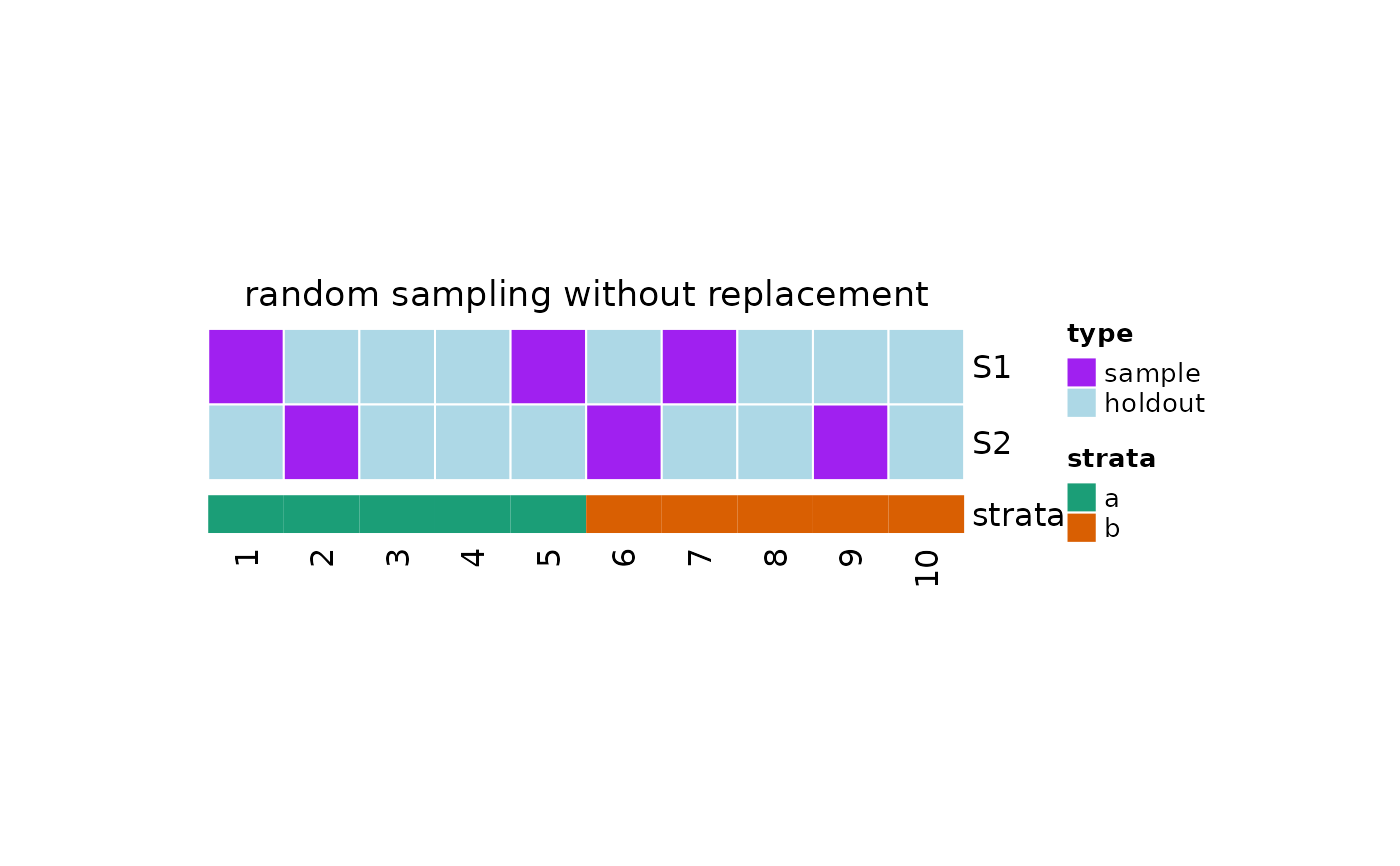
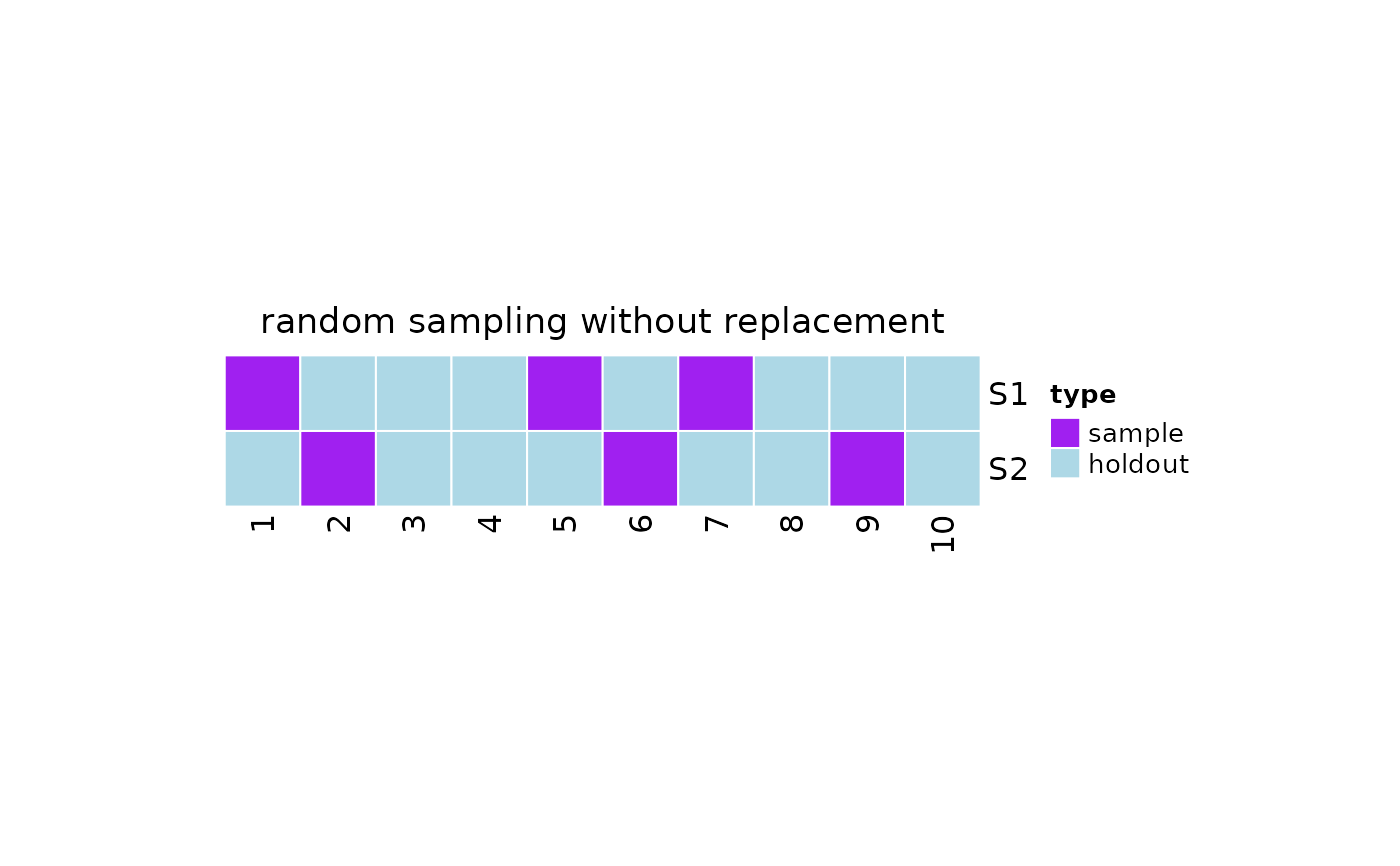
This function plot the samples taken from the population as an heatmap where each row corresponds to a different sample, while the columns represent the elements in the population. The elements belong to one of the following groups:
sample: the sample taken from the populationholdout: the data not selected in the sampleremoved: the data removed from the population and not considered for sampling
If the sampling technique allows for replacement, the number of repetition are shown in the cells of the heatmap.
If strata is provided, an annotation is added to the heatmap.
Examples
#check needed package
require(ComplexHeatmap, quietly = TRUE)
#> ========================================
#> ComplexHeatmap version 2.14.0
#> Bioconductor page: http://bioconductor.org/packages/ComplexHeatmap/
#> Github page: https://github.com/jokergoo/ComplexHeatmap
#> Documentation: http://jokergoo.github.io/ComplexHeatmap-reference
#>
#> If you use it in published research, please cite either one:
#> - Gu, Z. Complex Heatmap Visualization. iMeta 2022.
#> - Gu, Z. Complex heatmaps reveal patterns and correlations in multidimensional
#>     genomic data. Bioinformatics 2016.
#>
#>
#> The new InteractiveComplexHeatmap package can directly export static
#> complex heatmaps into an interactive Shiny app with zero effort. Have a try!
#>
#> This message can be suppressed by:
#>   suppressPackageStartupMessages(library(ComplexHeatmap))
#> ========================================

#resampling object
x = resampling(
 method = 'rswor',
 N = 10,
 samples = list(c(1,5,7), c(6,2,9))
)

#plot
plot(x)


#plot with strata
plot(x, strata = c(rep("a", 5), rep("b", 5)))
#plot with strata
plot(x, strata = c(rep("a", 5), rep("b", 5)))