This function generates a
ComplexHeatmap object.
Usage
heatmapSigScores(
data,
scores = NULL,
name = "summary\nscores",
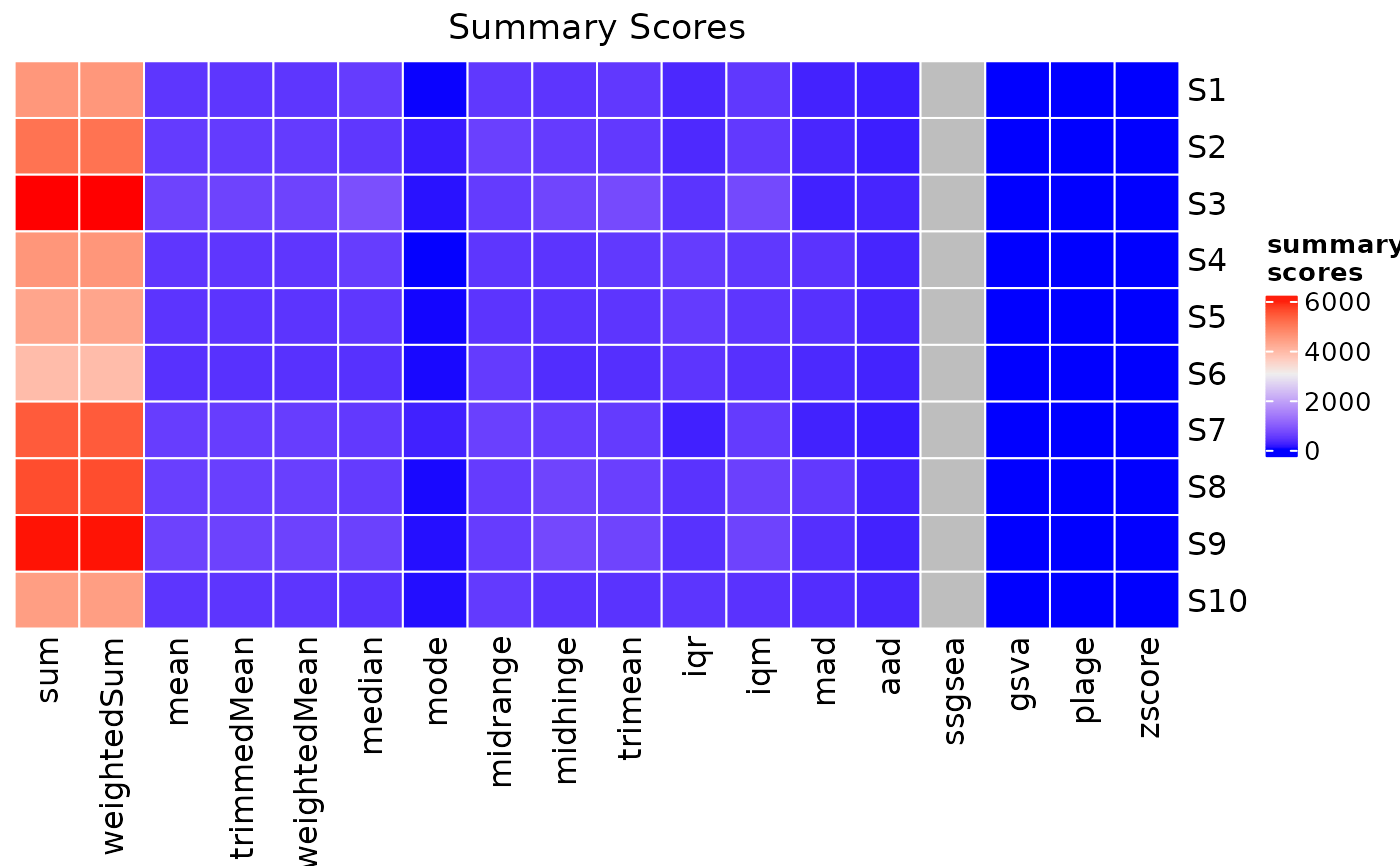
column_title = "Summary Scores",
...
)Arguments
- data
data frame, output of
computeSigScores- scores
(optional) character vector, indicating the summary score(s) to plot from
data- name
Name of the heatmap. By default the heatmap name is used as the title of the heatmap legend.
- column_title
Title on the column.
- ...
further arguments to internal function
heatMap
Examples
#Set seed for reproducibility
set.seed(seed = 5381L)

#Define row/col size
n = 10

#Create input matrix
x = matrix(
 data = stats::runif(n = n*n, min = 0, max = 1000),
 nrow = n,
 ncol = n,
 dimnames = list(
    paste0("g",seq(n)),
    paste0("S",seq(n))
 )
)

#Compute Summary Scores
x = computeSigScores(
 x = x,
 i = rownames(x)
)

#Plot scores
heatmapSigScores(data = x)