This function generates a
ComplexHeatmap object.
Usage
heatmapCorSigScores(
  data,
  cor = NULL,
  scores = NULL,
  name = "test\nstatistic",
  column_title = "Correlation",
  col = NULL,
  cluster_rows = FALSE,
  cluster_columns = FALSE,
  ...
)
Arguments
- data
data frame, output of
computeSigScores- cor
(optional) matrix containing the data to plot. If missing, a correlation matrix is internally computed using the default settings of function
computeSigScoresCorrelation- scores
(optional) character vector, indicating the summary score(s) to plot from
data- name
Name of the heatmap. By default the heatmap name is used as the title of the heatmap legend.
- column_title
Title on the column.
- col
A vector of colors if the color mapping is discrete or a color mapping function if the matrix is continuous numbers (should be generated by
colorRamp2). If the matrix is continuous, the value can also be a vector of colors so that colors can be interpolated. Pass toColorMapping. For more details and examples, please refer to https://jokergoo.github.io/ComplexHeatmap-reference/book/a-single-heatmap.html#colors .- cluster_rows
If the value is a logical, it controls whether to make cluster on rows. The value can also be a
hclustor adendrogramwhich already contains clustering. Check https://jokergoo.github.io/ComplexHeatmap-reference/book/a-single-heatmap.html#clustering .- cluster_columns
Whether make cluster on columns? Same settings as
cluster_rows.- ...
further arguments to internal function
heatMap
Examples
#Set seed for reproducibility
set.seed(seed = 5381L)
#Define row/col size
n = 10
#Create input matrix
x = matrix(
data = stats::runif(n = n*n, min = 0, max = 1000),
nrow = n,
ncol = n,
dimnames = list(
paste0("g",seq(n)),
paste0("S",seq(n))
)
)
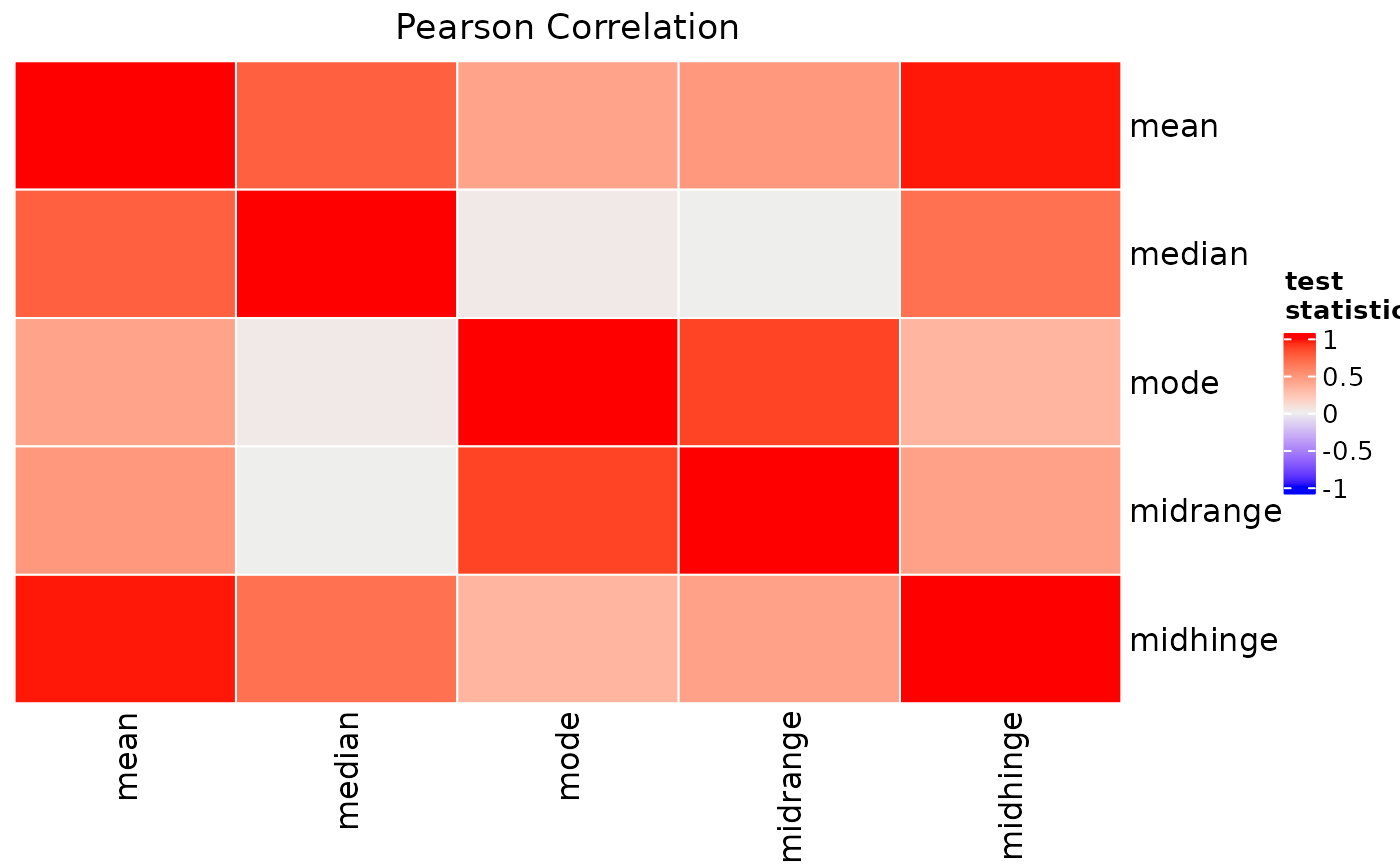
#Compute 5 Summary Scores
x = computeSigScores(
x = x,
i = rownames(x),
scores = c("mean", "median", "mode", "midrange", "midhinge")
)
#Plot correlation (correlation is internally computed)
heatmapCorSigScores(data = x)
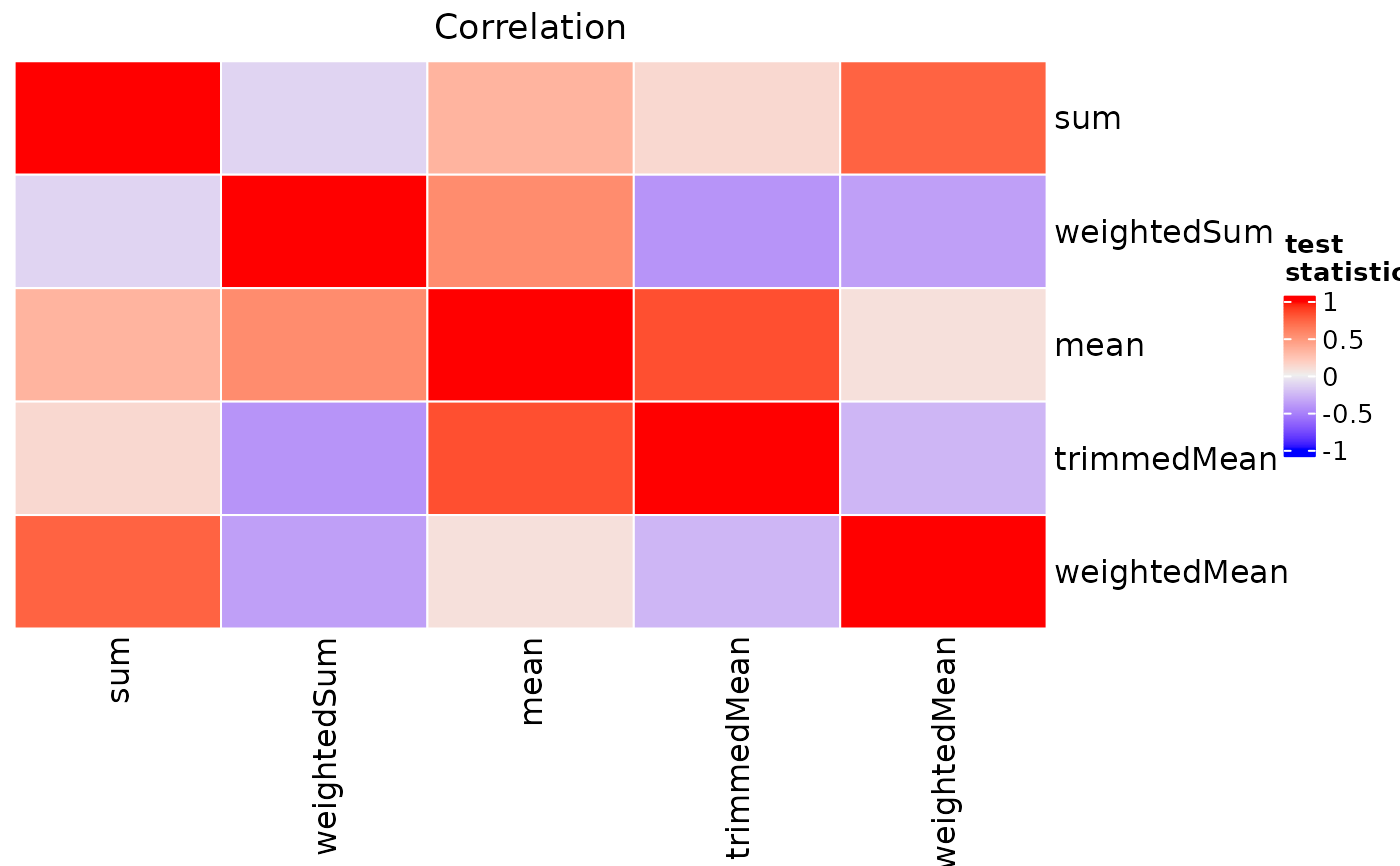
 #Use simulated correlation matrix
#Define row/col size
n = 5
#Create matrix
x = matrix(
data = 1,
nrow = n,
ncol = n,
dimnames = list(
getAvailableScores()$id[1:n],
getAvailableScores()$id[1:n]
)
)
#Create data
data = stats::runif(n = (((n*n)-n) / 2), min = -1, max = 1)
#Update upper triangular
x[upper.tri(x = x, diag = FALSE)] = data
#Update lower triangular to be symmetric
x[lower.tri(x = x, diag = FALSE)] = t(x)[lower.tri(x)]
#Plot
heatmapCorSigScores(cor = x)
#Use simulated correlation matrix
#Define row/col size
n = 5
#Create matrix
x = matrix(
data = 1,
nrow = n,
ncol = n,
dimnames = list(
getAvailableScores()$id[1:n],
getAvailableScores()$id[1:n]
)
)
#Create data
data = stats::runif(n = (((n*n)-n) / 2), min = -1, max = 1)
#Update upper triangular
x[upper.tri(x = x, diag = FALSE)] = data
#Update lower triangular to be symmetric
x[lower.tri(x = x, diag = FALSE)] = t(x)[lower.tri(x)]
#Plot
heatmapCorSigScores(cor = x)